Editor's review
Financial Charting Component has been tailored to lend helping hand to users to create high-end stock charts. With some fundamental knowledge of VB.Net and C Sharp, it enables users to build trading systems and stock charting applications with its integrated financial and mathematical engines. The component comes bundled with several handy features, such as its CLS Compliant language, integrates easily with MS Visual Studio 2003/2005, etc, to make the stock charting task easier for you. With its user-friendliness, interactivity, speedy performance, and stunning visual effects, the component can prove to be a competent assistant for you.
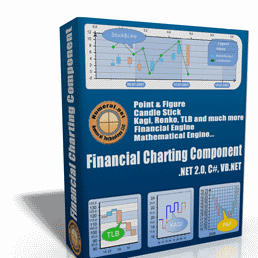
By integrating Financial Charting Component with MS Visual Studio, you can begin with creating financial charts. While creating the financial charts, you can alter its different attributes to give a desired mode and shape. You can use chart control and ChartDataGrid features to access and modify different properties. Using the properties you can mould chart’s Appearance that includes BackplaneStyle and InnerBorderStyle; and Axis consisting of AxisMargins, Primary X and Y Axis, and Secondary X and Y Axis. The Data set comprises of Application Settings, and Design allows you to set Name, GenerateMember, and Modifiers. Further includes layouts, chart areas, ticks and scaling, P& F series, TLB series, Binding, Zoom and Pan in/out, and various other features. The property grids have been grouped logically and tightly to lets you define desired attributes to stock charting application. It further supports Three Line Break (TLB), Candlestick, Renko, Kagi, etc; different known moving averages like MACD, EMA, HMA, and others; along with various graphic shapes API. The component facilitates data binding to XML, Dataset, CSV, and Array. It integrates the capacity to process large data volumes, and features financial and mathematical engines.
Financial Charting Component further supports large number of other functions to let you build quality stock charting application. The component is worthily marked at 4 rating points for its exclusive feature-set and ability to provide you with quality output.
User comments