Editor's review
The Gantt Chart is easy-in-use project plan system. This system allows you to specify complex tasks sequences - a task or multiple tasks can be required to be completed before other tasks can be started. The program has data import and export.
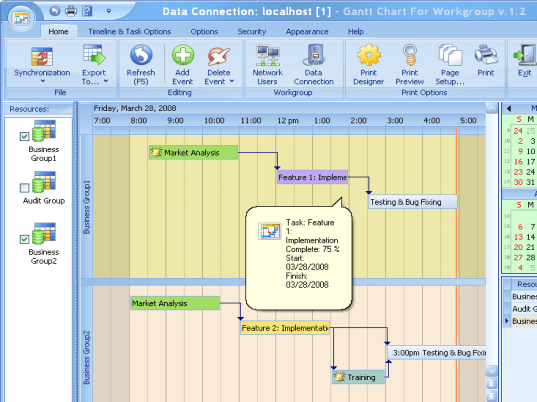
Pros: Gantt charts are immensely popular graphic tools that show up the interrelationships and interdependencies of tasks involved in a project. Gantt charts allow you to specify complex task sequences, sets of single/multiple tasks that must be completed before another one can be started. This application makes planning and monitoring of a project easy through the facilities to create a Gantt chart and then monitor activities based on the same. Dependencies are indicated by connector lines. These connectors can be edited to reflect any new dependencies quite easily. Tasks can be rescheduled as easily. For monitoring purposes the completion of tasks in percentage terms of individual tasks are indicated graphically. Overall progress indication also is available. It allows any specialist to create a profile to run a personal schedule. The program enables users to switch between profiles to view the schedule of any staff member, it is also possible to view multiple profiles simultaneously or open the schedules of several specialists at the same time.
Data import/ export from other programs is available. Export in MS Outlook data format of XML, HTML or TXT formats are possible. The program has a built-in Print Designer, which offers a variety of original templates and options to make a fine and clear printout of a schedule. There is a workgroup version available that allows users to work simultaneously over the network. Data can be easily archived into a secure back up device.
Cons: This is obviously for specialist users. One has to understand the basis of Gantt charts to project monitoring to be able to use this program effectively. Compatibility with MS Project and similar tools would be a useful feature.
Overall nice and easy to use this is really a good tool for project planning and monitoring. Overall a definite 4 star package.
User comments